| (One intermediate revision by the same user not shown) | |||
| Line 16: | Line 16: | ||
The drop-down menu provides the following single statistics from which to choose: | The drop-down menu provides the following single statistics from which to choose: | ||
| + | * Dialable | ||
* In Interactions Queued Per Day (Service) | * In Interactions Queued Per Day (Service) | ||
* In Interactions Short Abandoned Per Day (Service) | * In Interactions Short Abandoned Per Day (Service) | ||
| Line 48: | Line 49: | ||
| − | + | ||
</translate> | </translate> | ||
Latest revision as of 23:58, 13 November 2018
Contents
- Introduction
- Wallboard Builder Application
- Multiple Wallboards
- Colors and Style
- Widgets
- 1 Single Statistic
Single Statistic
The Single Statistic widget presents one type of statistic or metric for a given service interaction.
Settings
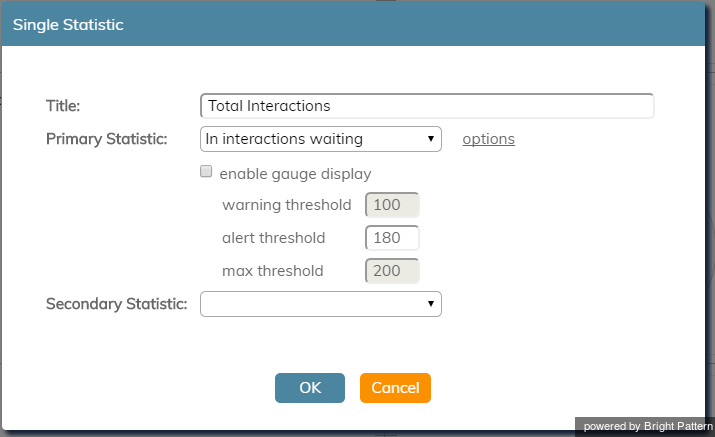
Users with the privilege Customize Wallboards may edit the control settings of wallboard widgets. Single Statistic settings are as follows.
Title
Title is the name of the statistic widget. Widget titles, along with their icons, are displayed in the widget selector.
Primary Statistic
The Primary Statistic is the main single statistic to be shown in the widget.
The drop-down menu provides the following single statistics from which to choose:
- Dialable
- In Interactions Queued Per Day (Service)
- In Interactions Short Abandoned Per Day (Service)
- In Interactions Abandoned Per Day (Service)
- In Calls Abandoned in Queue Ratio Per Day (Service)
- In Interactions Abandoned Ratio Per Day (Service)
- In Interactions Abandoned in Queue Ratio Per Day (Service)
- In Interactions Waiting (Service)
- In Max Wait Time
- Inbound Service Level threshold
- Percentage of inbound interactions answered in Service Level
- Inbound interactions received for the day
- Outbound successful call attempts for the day
options
Options may be defined for each statistic by selecting the checkbox beside options. In most cases, the option is the service selector.
enable gauge display
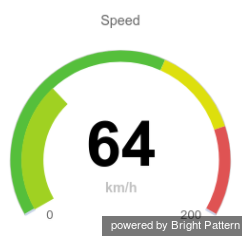
Selecting the enable gauge display checkbox will add the gauge display to the widget.
When enabled, the following values may be defined for the gauge display:
- warning threshold
- alert threshold
- max threshold
Secondary Statistic
The Secondary Statistic is a second statistic to be included in the widget, if desired. It is formatted as a percentage or duration. Possible secondary statistics are the same as those for the Primary Statistic described above.


