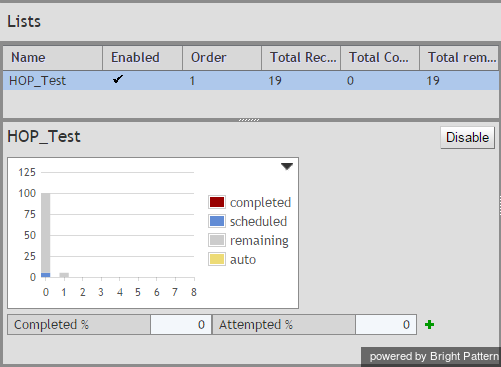
Lists View
Real-time metrics for specific lists within a selected campaign are displayed in the lower section of your Agent Desktop in a table called Lists. To view these metrics, first select the desired campaign in the General Campaign Metrics View. The Lists table will show all lists associated with the selected campaign in alphabetical order.
Like the General Campaign Metrics view, Lists view also has a section where you can define a set of custom metrics for each list-campaign association individually. To define a custom view for a particular list, first select this list in the general list metrics view.
Metrics available in the Lists View are a subset of the campaign metrics focused on records (as opposed to call attempts), except that they only apply to records of an individual list within the selected campaign. For descriptions of these metrics, see section List of List Metrics.
The following data is specific to the campaign list view:
- Parameter Enabled is an indication of whether the given list is currently enabled or disabled within the selected campaign. For more information, see section Enabling and Disabling Lists within a Campaign.
- Parameter Order means the order in which this list will be used within the given campaign relative to the other lists assigned to the same campaign. This is a static property defined in the campaign configuration. Records from lists with the same order will be dialed in a round-robin fashion.
- For lists with the same Order (see above), parameter Ratio defines the ratio at which records from these lists will be attempted. For example, if you have two lists with order 1, the first list has a ratio set to 2 and the second list has a ratio set to 3. Two records from the first list will be attempted, then three records from the second list will be attempted, then two records from the first list will be attempted, and so forth. This is a static property defined in the campaign configuration.
- The bar chart shows campaign list progress and efficiency expressed as attempts per completion. The horizontal axis shows passes through the campaign list records. A pass is a part of the campaign during which all campaign list records are attempted once. For each pass, the vertical axis shows the percent of records that were completed by agents, auto-completed (due to a DNC match or reaching maximum attempts), rescheduled, and remaining (not attempted on the given pass).

