Which Report to Use
My contact center’s hold times are too high. How do I see which agent is driving up that metric?
Hold time appears by the call (and can be seen in the Call Detail report for each call, or in the Service Metrics report by queue). Agents themselves do not get "credit" for the hold time of a call. Bright Pattern Contact Center reports on hold time at the service- or call-level only.
As hold times do not apply to an agent, there is not a way (even by modifying the report template in Jaspersoft Studio), to report on hold times by agent.
What you can do is review Not Ready times for agents, as this would be more of an indicator of who may be contributing to longer queue hold times. Note, however, that these agents may have valid reasons for being Not Ready, but that may at least give you an opportunity to coach from that perspective.
The Agent Time Allocation report provides a breakdown of the agent time spent. See section Agent Time Allocation of the Reporting Reference Guide for more information.
How do I know the number of calls handled by a team?
To verify the number of calls handled by the members of the specific team:
- Run the Agent Performance by Team report, selecting the team name. Inspect the "Number of Calls Handled" column.
- To cross reference, run an Interaction Record search, filtering by date and agent. Doing so will confirm the number of calls handled by the agents on the team.
For more information on Interaction record searching and agent performance by team, please see the Bright Pattern Contact Center Reporting Reference Guide.
If you notice that a large number of calls received were marked as "No Agent" or "abandoned', then you should:
- Review the team membership and make sure that the appropriate resources are assigned and skilled, and that they are logging in to the system daily to handle calls.
- Review your scenario logic to verify that the scenario is doing what you wish. For example, if there is currently no check for hours of operation (HOP), and instead, there is only a check for holidays and weekends, you may want to include an hours check based on service. Likewise, if you are only allowing calls to queue for a set number of seconds, after which they go to voicemail, then you may want to revisit the wait time on your Find Agent interval. See the Contact Center Administrator Guide for more information.
Use the Agent Activity report to identify trends/patterns in your agents' behavior, which may be resolved through coaching and training.
How do I view the metrics (specifically, SLA metrics) for inbound calls?
The typical reports to use for inbound call metrics are:
- Service Metrics (i.e., how the service performed)
- Agent Performance by Team (i.e., how the team performed for the inbound service)
For historical metrics, you should use the Service Metrics report.
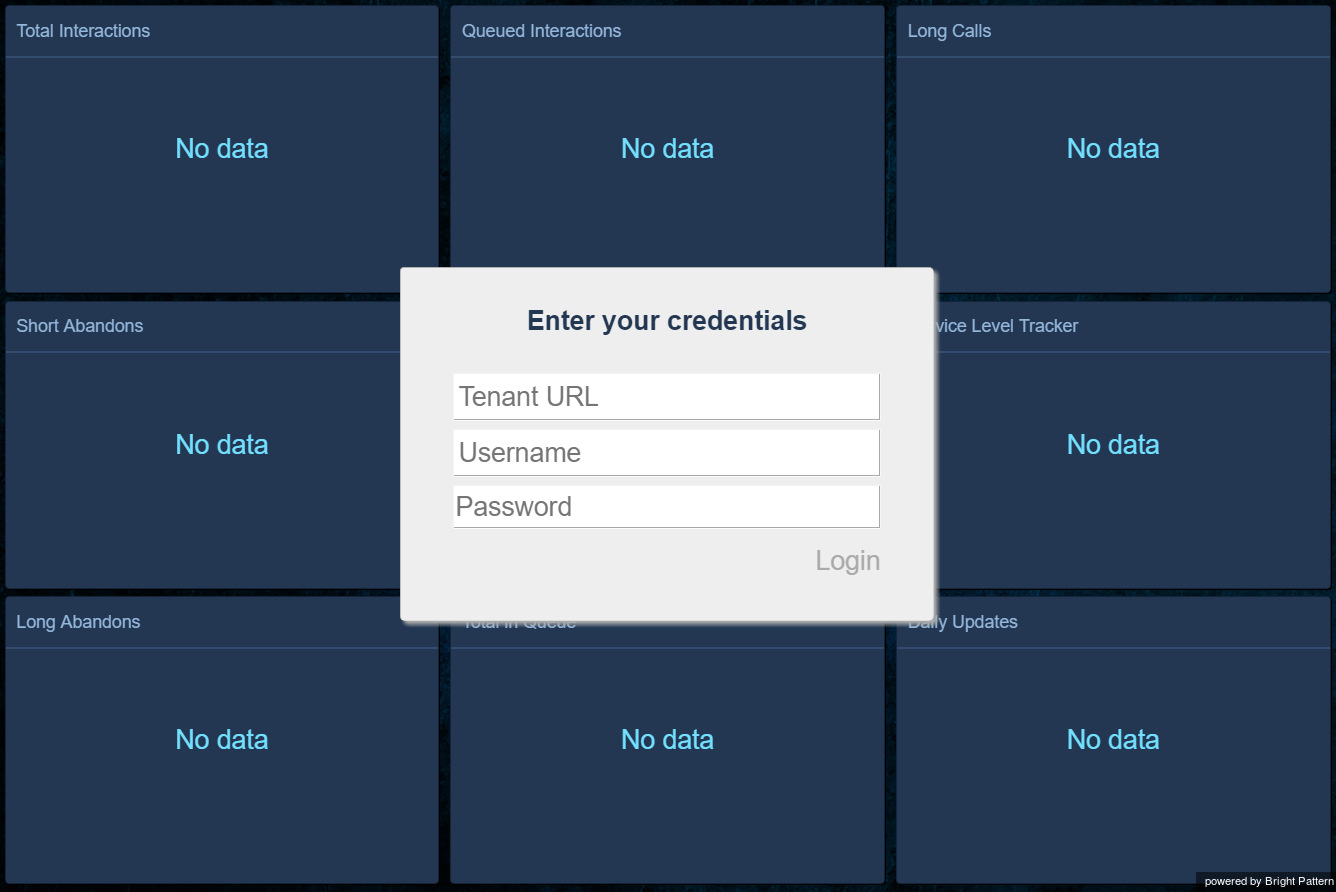
Wallboards display real-time data for specified metrics. For wallboards (note that our standard wallboard will show you common metrics), you should limit the metrics shown to your inbound metrics. To do so, create a wallboard user that has access to these services, such as a supervisor on a team that is assigned just these metrics. You can access your wallboard through your Bright Pattern tenant, using your tenant URL and username/password to log in.
When a caller requests a callback and the agent does call back, is the call then considered an inbound call or an outbound call?
For reporting purposes, the way that the interaction is reported depends on the report.
- The Call Detail report will give two entries: one for the inbound call, and one for the callback.
- The Service Metrics report will show this as a single inbound interaction.
- The Agent Performance report will show an inbound call.
- The supervisor dashboard will show this as a “Call Received” and also would log it under “CB Requested/CB Waiting metrics” where “CB” means “callback.”

