Contents
- Introduction
- Starting Your Working Session
- Viewing Real-time Metrics
- General Information About Metric Viewing
- Customization of Metric Views
- Understanding Real-time Metrics
- 1 Service Metrics View
- List of Service Metrics
- Skill Metrics View
- List of Skill Metrics
- Agent Metrics View
- List of Agent Metrics
- Real-Time Metric Alerts
- Active Agent Management
- Changing Agent State
- Individual Chat
- Team Chat
- Call Recording
- Call Monitoring, Coaching, and Barge-In
- Continuous Agent Monitoring
- Grading Calls in Progress
- Agent Screen Monitoring
- Managing Calendar Events
- Quality Management
- Campaign Operation
- General Information About Campaign Operation
- General Campaign Metrics View
- Individual Campaign Metrics View
- List of Campaign Metrics
- Quota Metrics View
- List of Quota Metrics
- Campaign Start and Stop
- Lists View
- List of List Metrics
- Enabling and Disabling Lists within a Campaign
- Campaign Teams View
- Adding and Removing Campaign Teams
- Email Queue Management
- General Information About Email Queue Management
- Assigning Email to an Agent
- Managing My Queues (Personal Email Queues)
Service Metrics View
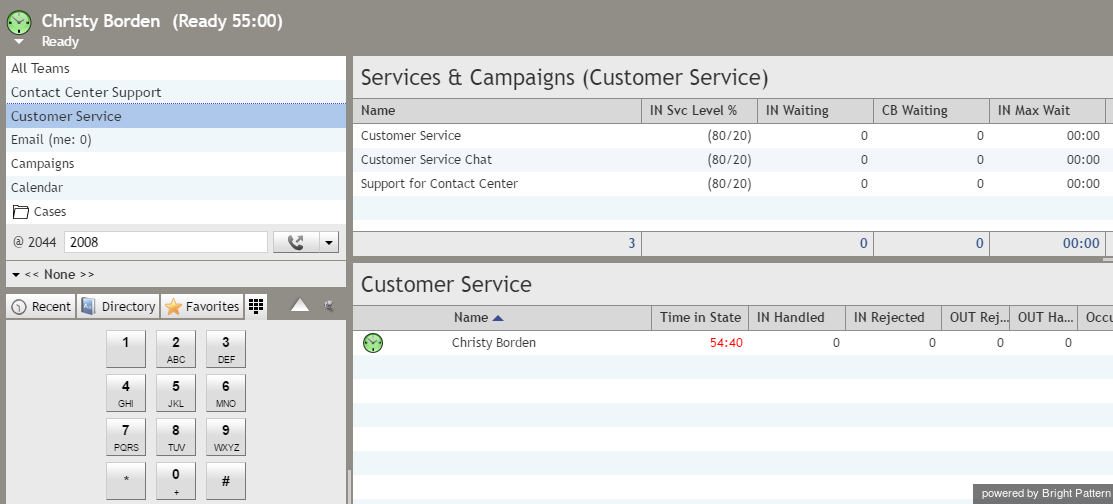
Service metrics are displayed in the Services & Campaigns view located in the top section of the Context Information Area. This view displays metrics for either all services assigned to the selected team, or all services assigned to all teams. You may toggle between specific team views and the All Teams view.
You can have services sorted automatically by the value of any currently displayed metric. The current sorting parameter will have the sorting icon displayed next to the metric name. By default, services are sorted alphabetically.
The last row of the service metrics view displays the cumulative values for all currently displayed services. In the Name column, the last row shows the total number of currently displayed services.
For detailed descriptions of the available service metrics, see section List of Service Metrics.
Service Metrics for One Team
Selecting a team name from the Active Communications List causes that team's service metrics to appear in the Context Information area. For any team selected, the name of the team appears in parentheses in the view's title. In the example shown, the service metrics are displayed under the title "Services & Campaigns (Customer Service)" where the team name is "Customer Service."
Service Metrics for All Teams
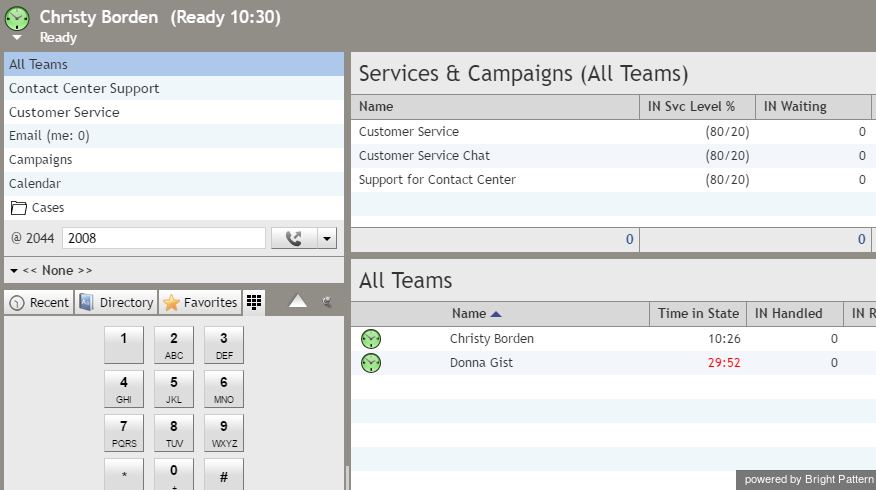
Selecting All Teams from the Active Communications List causes the service metrics for all teams for which the supervisor is assigned to appear in the Context Information area. You can tell, at a glance, that the view includes service metrics for all teams by looking at the view's title, which shows "All Teams" in parentheses.
How to Hide or Add Services
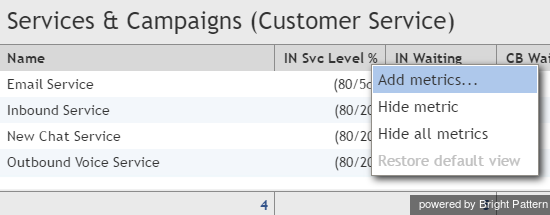
When you move your cursor over the service names, right-clicking or clicking the "down" icon will bring up a drop-down menu that gives several options. You can hide services, add services, hide all services, or restore the default view. If you do not remember the changes you made (i.e., you hid a service, want to add it back, but you do not remember the name of the service), you may restore the default view to make all services visible that were originally set in Agent Desktop.
To hide some services (e.g., hide overflow services assigned to your team in order to focus on your core services):
- Mouse over the corresponding service name, and click the drop-down menu icon that will appear.
- Select the Hide service option.
To add hidden services:
- Mouse over the name of the service below which you wish the hidden service to appear, and click the drop-down menu icon that will appear.
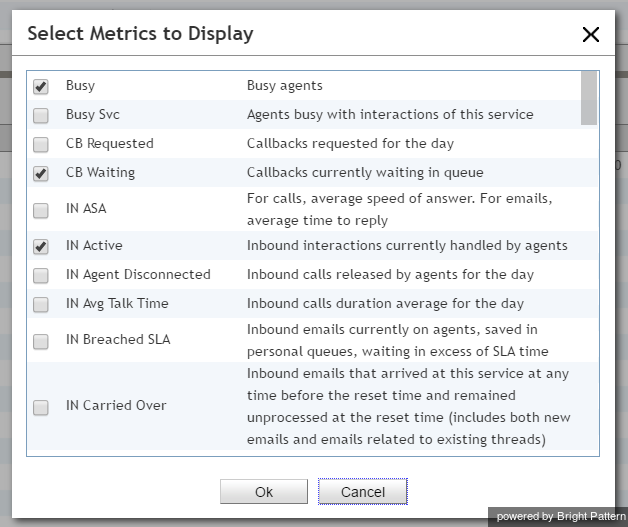
- Select the Add service… option. A list of service metrics will appear with checkboxes next to their names.
- Locate the desired service in the list and select its checkbox.
- Click OK.


